Your first poll, step by step
Build a three-option poll, choose how its results appear and place it in your slide design. These screenshots show the real Doppio sidebar in Google Slides.
Before you begin
Follow Getting started to install the Slides add-on and Chrome extension, sign in and create an event. Open Extensions → Doppio → Open Doppio. If an event code is already visible, your deck is connected.
The screenshots use the Mermaid Lagoon palette and Horizontal bars style, chosen in step 6. All chart numbers shown here are preview examples, not audience votes.
1. Choose Poll on an empty slide
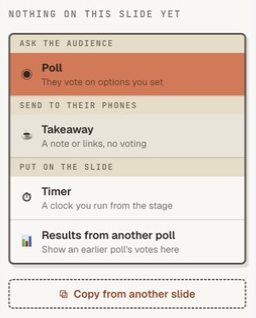
Add a slide and choose Layout → Blank in Google Slides for a clean starting point. In Doppio, find Nothing on this slide yet and click Poll under Ask the audience.
2. Write the question
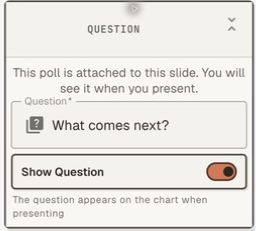
Under Question, enter What comes next? Leave Show Question on for this example. Turn it off if you want to create the heading yourself with Google Slides text.
3. Add three answers
Under Answers, enter Ideas, Teamwork and Skills. Leave Label each option selected so the chart displays those words. Empty answer boxes are not extra voting choices.
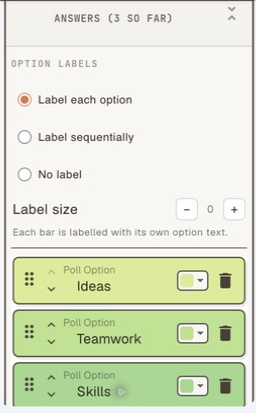
To use A, B, C or 1, 2, 3 instead, select Label sequentially. You can choose separately whether phones show the sequence, the answer text or both. No label lets you supply your own key in the slide. See Option labels for every setting.
4. Choose when results appear
Open Flow. For this example, keep Revealed on this slide → When the timer reaches 0. This gives people time to choose before they see the totals.
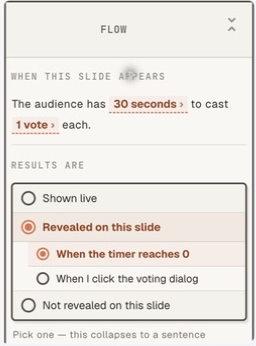
Use Shown live for results that update as votes arrive. To ask on slide 1 and reveal on slide 4, choose Not revealed on this slide, then follow Results from another poll.
5. Set the voting rules
Open Voting. Keep Duration at 30 seconds and Max votes at 1. Decide whether the countdown should appear on the slide, on phones, on both or on neither.
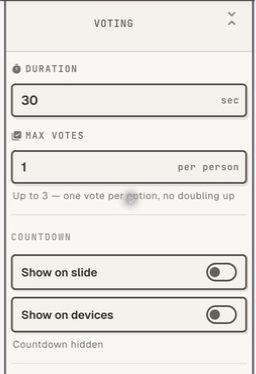
Scroll further down for One-tap voting. With this off, people confirm before submitting their answer. Hiding the countdown does not remove the voting time limit.
6. Choose the colours and chart style
Open Colours & Theme. Choose Mermaid Lagoon, then set Chart style to Horizontal bars. Keep Match Palette (Light) as the background.
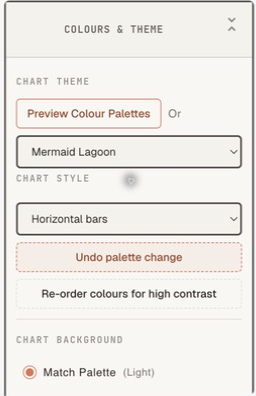
Use Preview Colour Palettes to compare all nine palettes. The chart style guide explains all six layouts and shows examples built into finished slides.
7. Save and position the chart
Click Save poll at the top of the sidebar. Wait for Ready to Present before moving to another slide. After this first save, poll edits save automatically.
Click the chart on the slide to select its image. Move it into position and use a corner handle to resize it without stretching the proportions. Leave enough room for the question and answer labels.
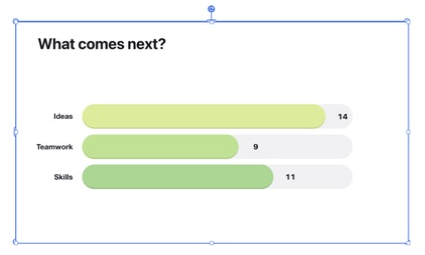
When you return to the Doppio sidebar, its preview reflects your settings. The sample totals let you check the layout before inviting an audience.
8. Make it part of your slide
Use Google Slides for your heading, photographs, shapes and answer key. Place the Doppio chart beside them and choose colours that suit the design. You can hide the chart question when your slide already supplies a heading, and choose a transparent background where appropriate.
See two finished slide examples: a letter-labelled Big Pop chart beside photographs, and an Editorial Grid chart with full answer text.
Your poll is now saved. Follow Running a live session when you are ready to invite an audience and present.